Thinking about rolling out a QR code menu in 2026, but not convinced the QR code menu ROI is actually there? You are not the only one. Most operators like the idea of digital menus and hate the idea of paying for one more tool that never pays for itself.
In the last few years, QR Code Menu for Restaurants have gone from pandemic workaround to standard infrastructure. Some QR code menu statistics suggest roughly three quarters of restaurants use QR codes to access digital menus, and about half of diners have scanned a code to see a menu at least once.
Adoption on its own does not equal profit though. Some venues see higher checks and lower costs. Others end up with frustrated guests and no obvious savings. This guide breaks down QR code menu cost, payback times and realistic digital menu ROI benchmarks so you can decide whether QR code menu ROI makes sense for your concept.
What we looked at: methodology and sample
To keep this practical, everything here is built from a mix of real world data, not theory.
We pulled qr code menu statistics and examples from:
- Large scale data from more than 10,000 independent restaurants, including printing costs, QR code menu cost, subscription fees and payback time
- Industry reports on QR code adoption, consumer sentiment and digital ordering behavior in the United States, Europe, Asia and major tourist cities
- Vendor case studies that quantify revenue lift, average check increases and printing savings after switching from paper to digital menus
- Independent surveys from 2024 on how guests feel about QR code menus compared with printed menus

When you see a hard number, it is either from those sources or from a simple worked example based on those numbers. Where something is a model rather than a fact, treat it as a directional benchmark, not a promise.
Adoption of QR code menus in 2026
Digital menus are no longer niche.
Across segments, several studies report that roughly 75 percent of restaurants worldwide use QR codes to access digital menus, while about 49 percent of consumers have used a QR code to view a menu.
Most operators do not run QR only though. One technical report found that about 85 percent of restaurants keep QR menu systems in place even as usage has normalised, using them as a parallel or backup channel rather than the sole menu format.
Guest preference is more complicated. A 2024 survey of 850 US diners reported that 81 percent still prefer a physical menu, and only about 1 percent rated QR codes as their favourite menu format.
The pattern is simple:
- Restaurants are heavily invested in QR code menus
- Guests still like printed menus
- The strongest performers tend to use a hybrid approach rather than going QR only
Adoption by region
Regional behavior has a direct impact on scan rate, which feeds straight into your QR code menu ROI.
North America
- QR code usage is now mainstream
- Around 95 percent of consumers know how to scan a QR code
- More than 100 million Americans are expected to scan QR codes by 2026
- Restaurants in major US cities lean hard into digital ordering, with some surveys tying digital ordering to roughly 20 percent higher spend when guests can order through digital tools
Europe and the UK
- QR literacy is similarly high, with more than 86 percent of smartphone users having scanned a QR code at least once
- Digital menus fit tourism heavy markets where multilingual menus and instant translations matter
- Tourist hubs such as Paris and Barcelona report high penetration of QR menus, particularly in venues with large international guest mixes
Tourist destinations globally
One 2024 analysis suggested that about 82 percent of restaurants in major tourist hotspots such as Paris, Tokyo, Barcelona and New York now use digital QR menus, and around 71 percent of tourists say they prefer restaurants that can translate menus into their own language in seconds.
Asia
- QR code payments are part of daily life in markets such as China and India
- Mobile QR payments dominate many cashless transactions
- That behavior carries over into QR menus, where scanning at the table feels normal rather than like a gimmick
If your restaurant sits in a tech friendly or tourist heavy market, adoption data is on your side. You are more likely to achieve the scan volume that makes the economics of digital menu ROI work, as long as the experience is smooth.
Adoption by restaurant type
Different concepts roll out QR menus at very different speeds.
From a study of more than 10,000 venues:
- Mobile first, volume driven venues adopt fastest
Think quick service, food courts and busy cafes - Experience driven concepts, such as upscale casual and fine dining, move slower and usually opt for QR menus alongside printed menus
Digital menu platforms in English speaking markets report that more than 40 percent of restaurants use a digital menu as their primary menu tool. This is strongest in concepts where speed, table turns and menu updates matter more than tactile menus.

In short:
- Fast casual and quick service
High adoption, strong operational fit - Casual dining and bars
Rising adoption, hybrid printed plus QR model works best - Fine dining
Selective adoption, QR menus usually support premium printed menus instead of replacing them
Your restaurant type should heavily influence how aggressively you chase QR code menu ROI.
Cost breakdown: paper menus vs digital menus
Now for QR code menu cost compared with traditional printing.
From a large sample of independent restaurants, one 2024 dataset found:
- Average digital menu subscription cost around 12.50 dollars per month, roughly 150 dollars per year per location
- For restaurants reprinting menus multiple times each month, average yearly savings after switching to QR menus were about 3,800 dollars
- Break even was roughly 13 months for monthly reprints, and about 6 to 7 months for venues that reprinted twice per month
Other providers reported similar results. One European digital menu platform cited operators saving up to 500 euros per month in printing costs, mainly by avoiding seasonal reprints and last minute price changes.
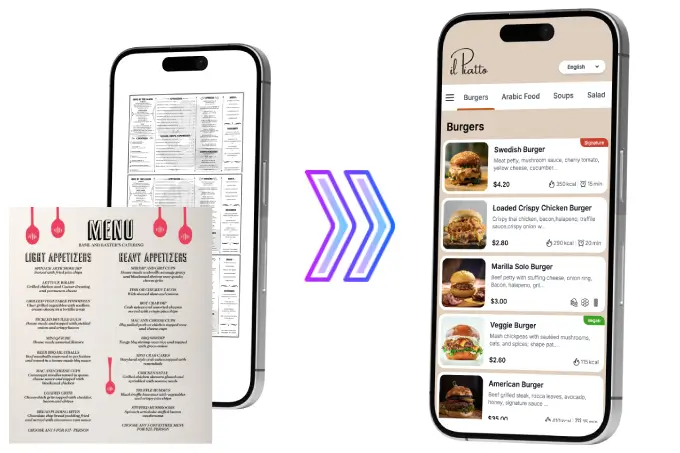
On the print side, menu printers typically charge a few hundred dollars for a batch of several hundred menus. That does not include design time or any extra cost for emergency reprints when suppliers change prices.
Typical QR menu subscription tiers look like this:
- Free or freemium tools
Basic menus, limited branding, stripped down feature sets - Entry level paid plans around 7 to 15 dollars per month per location
- Advanced plans around 20 to 40 dollars per month
Multi menu setups, richer configuration and better branding support
Even before you count any revenue changes, a typical independent restaurant that reprints often is trading roughly 150 to 500 dollars per year in QR code menu cost for somewhere between 2,000 and 4,000 dollars in print savings.
If you only print once a year and rarely change pricing, the print savings story is weaker and QR menu ROI will depend more on revenue and operations.
Revenue impact: average check size, upsells and promotions
This is where QR code menu ROI usually gets interesting.
When digital menus are set up well, several sources report 10 to 30 percent higher average checks compared with paper only flows.
Examples:
- A case study from Bahrain reported that after implementing a tailored QR code menu, a beachfront venue saw a 20 percent increase in average check. Guests liked scanning to see specials and photos, and management liked how easy it became to tweak pricing and promotions.
- Tourist focused restaurants using QR menus with translations and strong visuals have reported 23 to 38 percent higher average spend per tourist compared with their previous paper only setups.
Why does average check go up?
- Guests browse more of the menu while they wait and discover high margin items
- Digital menus can surface add ons and pairings consistently instead of relying on server memory
- Promotions can be dynamic
For example, pushing desserts after mains are ordered, or showing a “make it large” prompt when someone taps a drink
The data is not universally positive though. The same 10,000 restaurant dataset that tracks QR code menu statistics also notes that revenue impact is not always positive. In fine dining, guests often dislike photo heavy layouts, and for some of those venues printed menus still deliver higher spend per head.
The takeaway: revenue upside is real, but only if your audience and brand positioning support a digital first, visually rich buying journey.
Operational impact: printing, staff time and error reduction
ROI is not just about more revenue. It is also about removing friction and waste.
Digital menu platforms report that switching to a QR based menu can:
- Cut ordering errors by around 30 percent when guests see live availability and clear allergen information
- Reduce wait times by about 20 percent because guests can start browsing the QR code menu immediately instead of waiting for a printed menu
- Reduce customer complaints related to out of stock items and incorrect menu information by more than half
- Make menu updates more than four times more frequent, which makes it easier to test new dishes or pricing without paying for a print run
There is also a labor angle:
- Servers spend less time explaining basic allergen details or apologising for menu changes
- Time and attention shift toward hospitality, table touches and recovery moments
- Training new staff is easier because the digital menu is always accurate
All of that translates into fewer comps, fewer discounts, less wasted prep and smoother shifts. Those gains feed directly into digital menu ROI, even if you do not enable full self ordering.
QR code menu ROI benchmarks by restaurant type
Now let us turn the data into directional benchmarks. These are not guarantees. They are ranges built from the statistics above plus simple models.

From the 10,000 restaurant dataset, a typical independent restaurant that reprinted menus several times per month:
- Paid around 150 dollars per year for digital menu access
- Saved roughly 3,800 dollars per year on printing alone
- Often saw extra revenue from higher average checks
That means ROI from print savings alone landed around 2,000 to 2,500 percent annually before counting any revenue uplift.
Layer in conservative revenue and labor changes and you get rough QR code menu ROI benchmarks like these.
Fast casual and quick service
- Younger, mobile heavy guests, high table turns
- A 5 to 15 percent gain in average check is realistic when upsells and photos are done properly
- Combined with print savings, it is common to recover the annual subscription cost within one to three months
Casual dining, bars and busy tourist restaurants
- Mix of locals and visitors, visuals and translations matter
- Among guests who actually use the QR menu, 5 to 20 percent higher average spend is achievable, especially for tourists
- Payback often lands inside the first year if you were reprinting menus several times a year
Cafes and coffee shops
- Tighter margins, but frequent menu changes and specials
- Printing savings plus a modest bump in add on sales such as pastries or extra shots can still deliver clear positive digital menu ROI
Fine dining and very traditional concepts
- Revenue lift is far less consistent
- Many guests expect tactile, designed menus and heavier in person storytelling
- QR menus often work best here as a backup, a wine list tool or for translations, not as the primary menu
Again, these are benchmarks, not promises. Your actual QR code menu ROI will depend on scan rates, menu engineering and execution.
When a digital menu is not worth it
There are clear situations where a full digital menu rollout is unlikely to pay off.
The 10,000 restaurant study highlighted scenarios where QR menus consistently underperform or barely move the needle:
- You reprint menus once a year or less, so printing costs are low
- Your customer base skews heavily older, with many guests over 60 who strongly prefer physical menus
- Your menu is extremely stable and has not changed meaningfully for several years
- You run a fine dining concept where a printed menu is part of the theatre and brand
Guest sentiment backs this up. In a widely cited survey, 81 percent of diners said they prefer a physical menu and only 1 percent said QR codes were their favourite way to view a menu. Common complaints included:
- Small or hard to read text on phones
- Frustration with having to use a phone at the table
- Unreliable connections or dead batteries
In these contexts, a hybrid approach usually wins. You still gain operational and compliance benefits from digital menus while handing printed menus to guests by default.
How to calculate QR code menu ROI for your restaurant
Here is a simple way to calculate QR code menu ROI for your own venue.
Step 1: Capture your current costs and performance
List your current numbers:
- Annual printing spend, including design and emergency reprints
- Average monthly covers
- Average check size
- Gross margin on food and drink
- Staff time lost to explaining menu changes, allergen questions or fixing menu related errors
Step 2: Estimate realistic changes with a digital menu
Use conservative numbers even if case studies sound optimistic.
- Print savings
Base this on your real reprint frequency
If you reprint often, using a figure similar to the 3,800 dollars average savings is reasonable
If you reprint only once a year, use a much lower number - Revenue uplift
For mobile friendly guests and a visually rich menu with upsells, a 5 to 10 percent increase in average check is a sensible starting range
Many case studies report 10 to 30 percent, but do not build your model on the highest claims - Labor savings
Estimate hours saved each week from fewer menu explanations and corrections
Multiply by your hourly labor cost to get a monthly number
Step 3: Run the numbers
Use simple formulas.
Additional profit from higher checks per month
- Monthly revenue × expected check uplift × gross margin
Cost savings per month
- Printing savings per year divided by 12
- Plus any labor savings per month
Net benefit per month
- Additional profit per month
- Plus cost savings per month
- Minus your digital menu subscription cost
ROI
- Net annual benefit divided by annual digital menu cost
Example:
- 2,500 covers per month
- Average check 20 dollars
- Monthly revenue 50,000 dollars
- Expected check uplift 5 percent
- Gross margin 30 percent
Additional profit from higher checks:
- 50,000 × 0.05 × 0.30 = 750 dollars per month
Printing savings:
- Current printing spend 1,800 dollars per year
- Savings 150 dollars per month
Digital menu cost:
- 20 dollars per month
Net monthly benefit:
- 750 + 150 – 20 = 880 dollars
Net annual benefit:
- 880 × 12 = 10,560 dollars
Digital menu cost per year:
- 240 dollars
ROI:
- About 44 times your spend
Real life results will vary, but this shows why QR code menu ROI can be so strong when fit and execution are right.
How TableQR supports positive ROI
Where does TableQR sit in this picture?
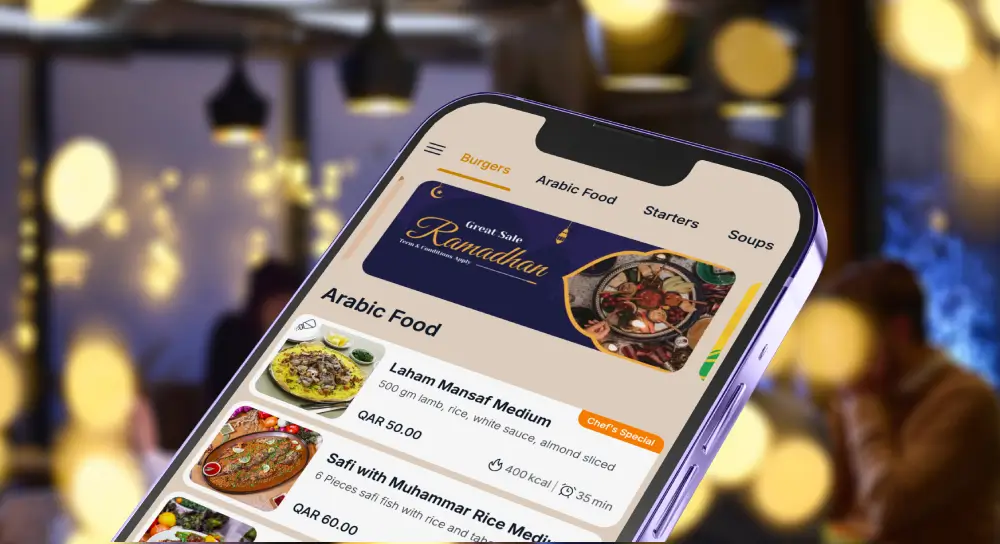
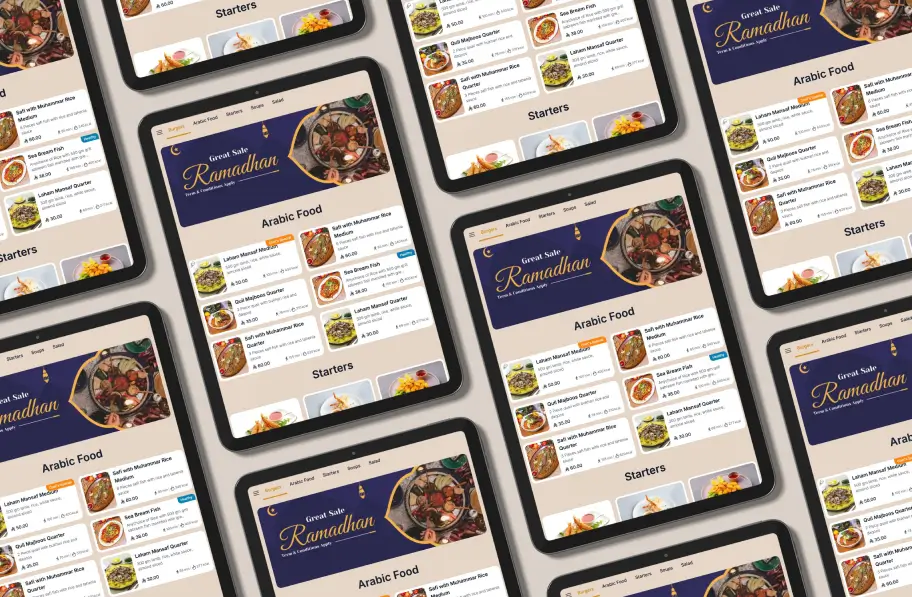
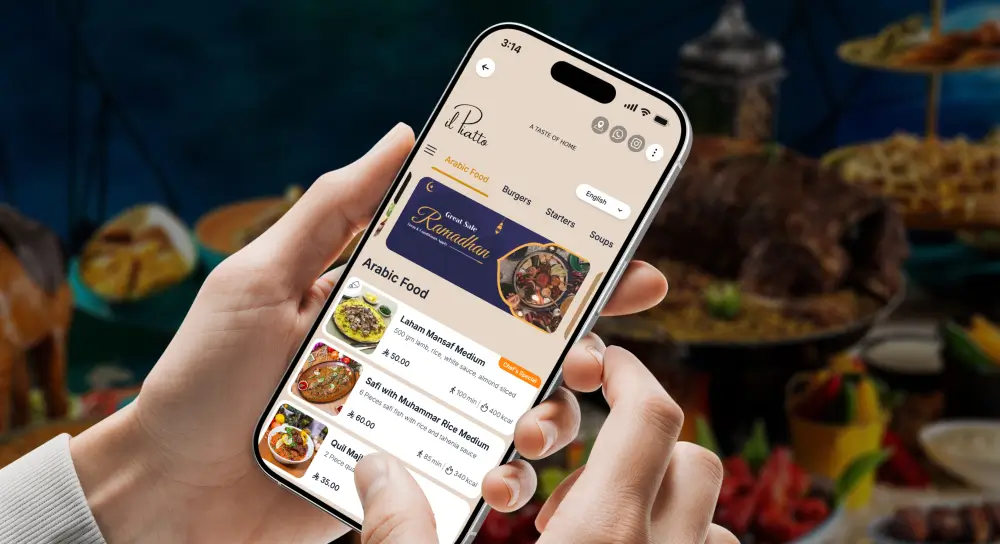
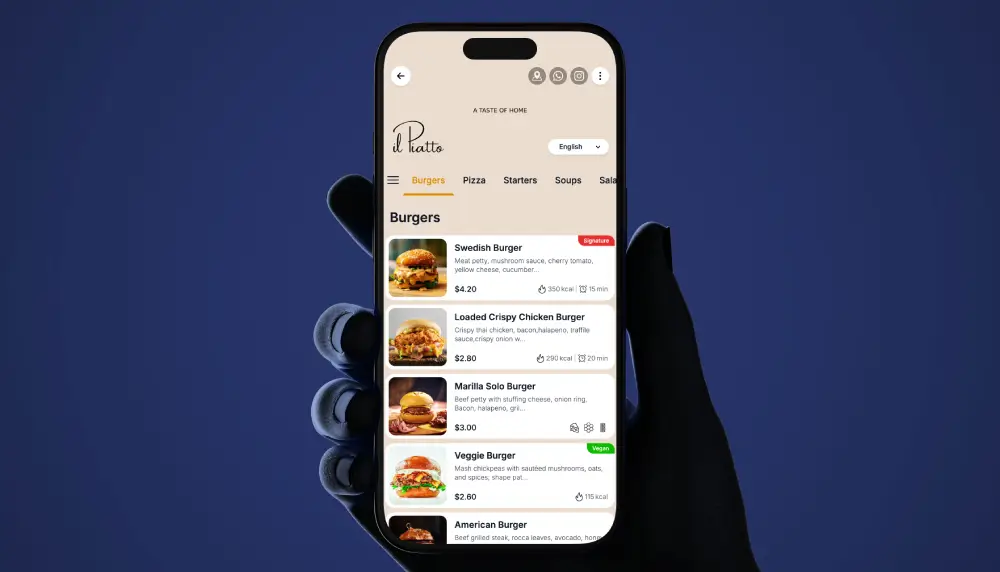
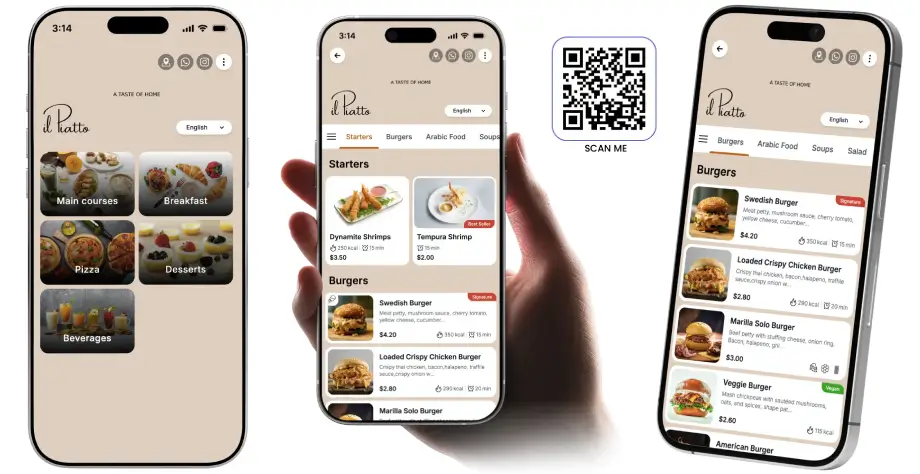
TableQR is a global QR code digital menu platform built for busy hospitality teams. Guests scan a single QR code and in seconds see a clean, branded online menu that looks good on any phone, tablet or iPad and stays accurate all day.
That design supports ROI in a few specific ways:
- Higher scan rates
Fast, mobile first menus make it more likely guests actually use the QR code instead of asking for paper, which is essential if you want any digital menu ROI at all - Always accurate menus
Because the menu updates instantly, you do not need to comp items that are printed but sold out
Seasonal dishes and price changes can go live in minutes, with no printer and no design queue - Better menu engineering
A focused, readable layout with clear categories and item details makes it easier to highlight profitable dishes, promote specials and guide guests toward higher margin choices - Local and tourist friendly
The same QR code can serve local regulars and international visitors, which is especially important in tourist heavy markets that rely on translations and photo support
TableQR gives you the foundations that the data says you need for strong QR code menu ROI without piling extra complexity onto your floor. Talk to Digital Menu Expert
Final thoughts and next step
QR code menus are not magic. In 2026, they are simply another lever you can use to improve margins and guest experience.
If you change menus often, serve a mobile friendly audience or operate in a tourist heavy area, the numbers suggest that a well executed digital menu can deliver fast payback and a very healthy digital menu ROI. If your concept is stable, traditional or heavily fine dining, a hybrid approach with QR codes supporting premium printed menus will likely work better.
The smart next step is simple:
- Run your own numbers using the ROI steps above
- Test a limited rollout of TableQR on a few sections or shifts
- Measure average check size, guest complaints and reprint costs for a month
- Decide whether to scale up based on data, not guesses
That way you treat QR code menus like any other investment in your restaurant: something that has to earn its keep on the P and L.